
Universal Asset Coverage
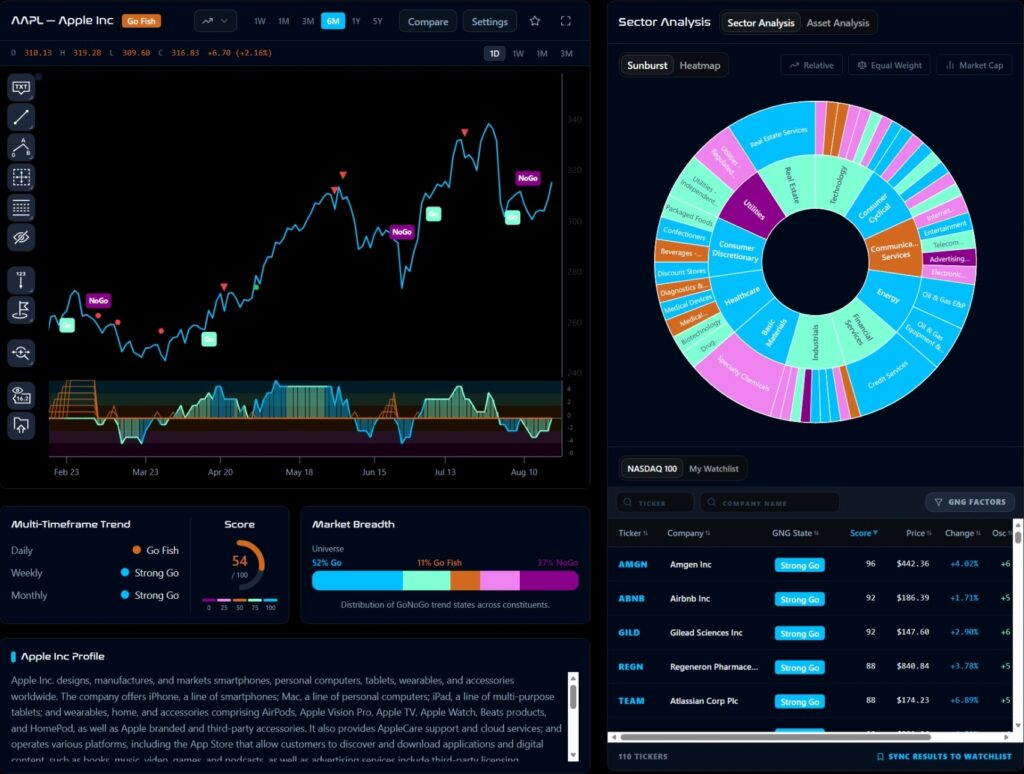
Designed to analyze any security, asset class, or time frame without changing your workflow, giving you consistent trend awareness across all your charts.
The democratization of data has led to an abundance of information and the obscuring of insights. GoNoGo Charts® provides investors with a clear view of market direction and trend by blending robust technical concepts into simple visuals.
The GoNoGo Differnece
In technical analysis, complex charts overwhelm traders and hide key insights. GoNoGo Charts® removes indicator overload, keeping you focused on price while clear visual colors reflect trend strength.
Designed to analyze any security, asset class, or time frame without changing your workflow, giving you consistent trend awareness across all your charts.
Blends proven technical principles with widely used statistical measures to remove indicator overload and eliminate emotional bias during critical trade decisions.
Requires no prior background in technical, quantitative, fundamental, or statistical analysis, making powerful visualization tools instantly accessible to all investors.
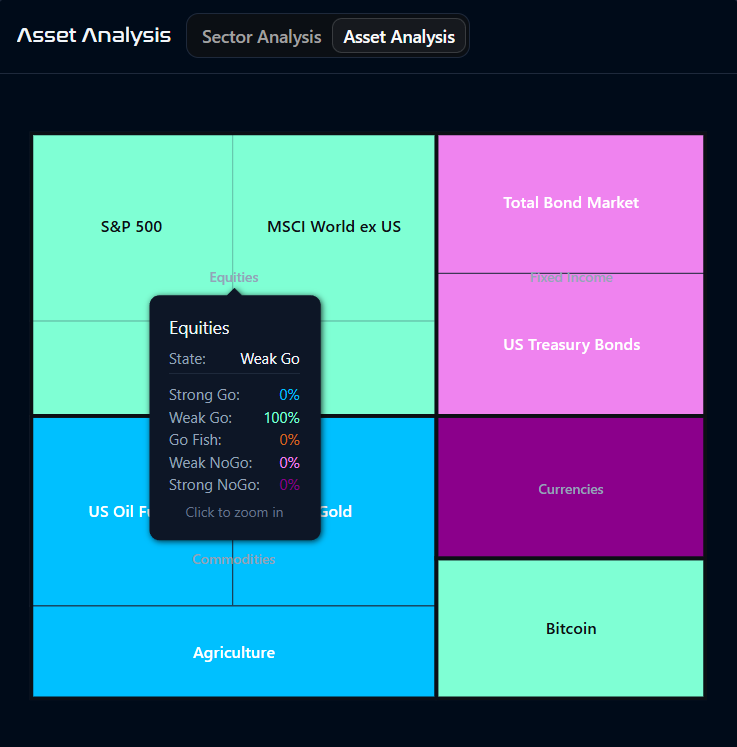
Available for individual and institutional market participants as a subscription-based tool, plugin, or feature across major charting services, brokerage platforms, and data software.
Portfolio Managers & Traders: Get immediately actionable intelligence on the risk/reward of every trade decision.
Research Analysts: Enhance research reports with proprietary indicators and simplified visuals.
Financial Advisors: Bring clarity to portfolio returns and asset allocations in a way clients can understand.
Individual Investors: Understand the direction and continuity of price trends without getting overwhelmed by contradictory indicators.
Leadership
Developed by industry experts with decades of experience in financial services, education, and product development.

Co Founder

Co Founder