Trend Identification
Combines momentum, pattern recognition, and trend-following metrics into a unified 5-color visual scale to instantly show market direction and strength.
The GoNoGo Visual Suite
Stop juggling dozens of conflicting technical indicators. GoNoGo Charts synthesizes complex market data into an intuitive, color-coded ecosystem so you can trade with confidence, objectivity, and speed.
No More Indicator Overload
Zero Emotional Bias
Universal Application
How It Works
Behind every signal is a robust quantitative engine. GoNoGo Charts brings four foundational dimensions of market analysis together into one synchronized workflow.
Combines momentum, pattern recognition, and trend-following metrics into a unified 5-color visual scale to instantly show market direction and strength.
Measures the velocity of price movement relative to the primary trend, highlighting optimal entry points and potential trend exhaustion.
Tracks market consolidation near critical inflection points to help traders anticipate explosive breakout movements before they happen.
Evaluates performance against benchmark indices or sector leaders, ensuring capital is allocated to true market outperformers.
Core Engine
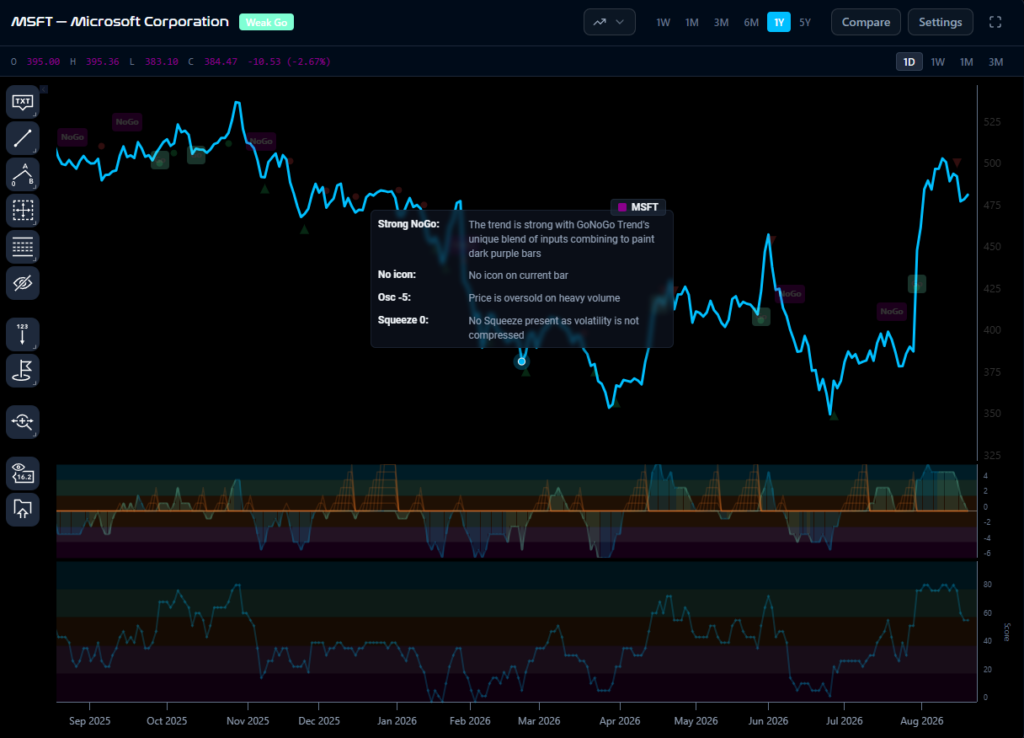
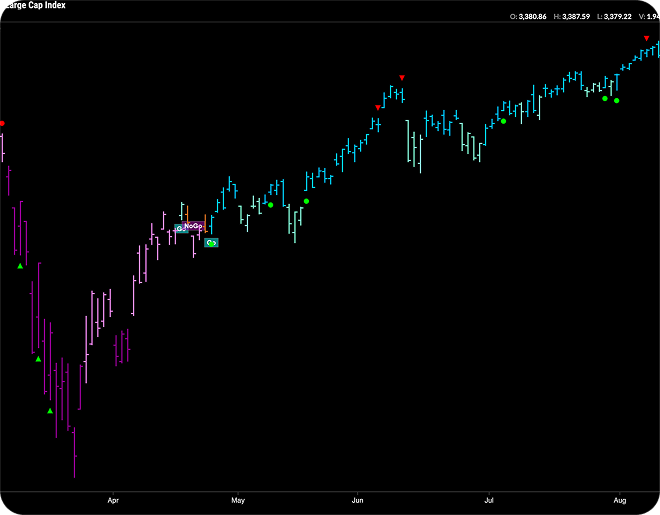
GoNoGo Trend® processes multiple technical inputs behind the scenes to paint price bars across a clear 5-color spectrum. It delivers an immediate, unbiased readout of trend direction and strength without cluttering your charts.
Key Capabilities:
Unified Visual Output: Replaces crowded chart lines with clear, color-coded price action.
Five-State Spectrum: Instantly gauge trend direction and strength from Strong Go to Strong NoGo.
Universal Coverage: Works seamlessly across equities, forex, commodities, crypto, and fixed income.
Sit pharetra eget duis
Timing & Precision
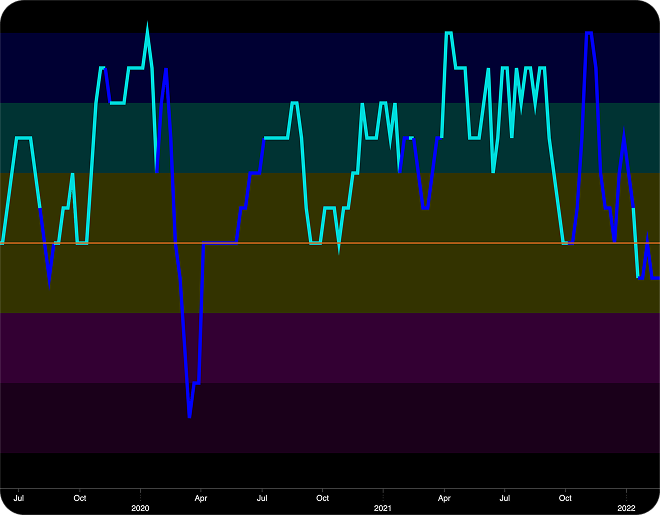
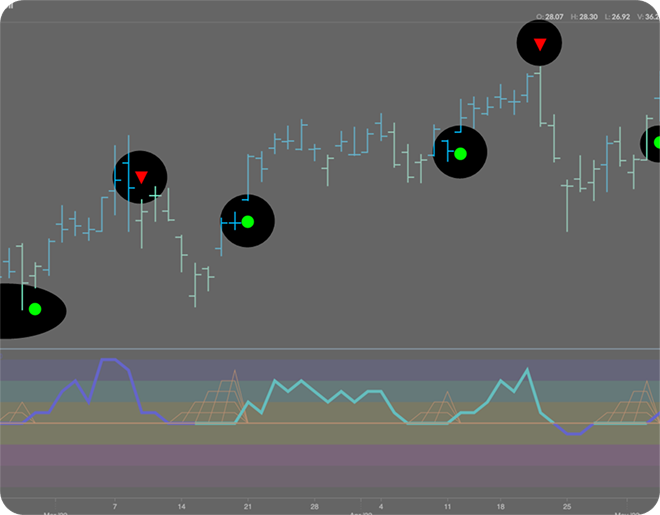
The GoNoGo Oscillator® measures momentum velocity within the active trend, helping you isolate low-risk entry setups, avoid buying at local tops, and manage trade risk with precision.
Key Capabilities:
Zero-Line Support & Resistance: Pinpoints ideal re-entry opportunities as momentum tests zero.
Volume Confirmation: Shades bars when volume exceeds average levels to confirm momentum strength.
GoNoGo Icons® Integration: Places actionable setup cues directly on your price chart.
Breakout Anticipation
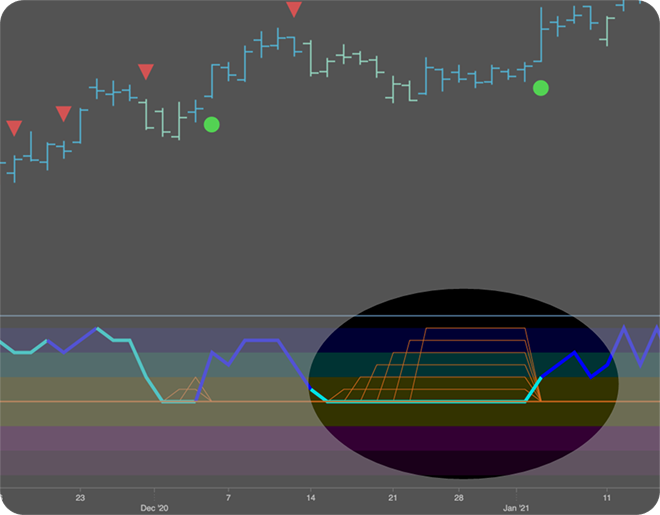
GoNoGo Squeeze® tracks price compression as momentum stalls near the zero line, acting as an early warning system that lets you position before high-volatility breakouts happen.
Key Capabilities:
Visual Grid System: Displays a dynamic grid on the oscillator panel to visualize building market energy.
Pre-Breakout Alerts: Identifies tight consolidation zones early so you can plan your trades in advance.
Integrated Alignment: Ensures you trade volatility breakouts in line with the primary GoNoGo Trend®.
Capital Allocation
GoNoGo RelStrength® applies the 5-color framework directly to relative performance ratio charts, letting you compare any security against a benchmark index or sector peer in seconds.
Key Capabilities:
Direct Benchmark Comparison: Evaluate any asset against indices like the S&P 500 or sector ETFs.
Ratio Trend Colors: Uses the familiar color scale to simplify relative performance analysis.
Leadership Identification: Helps traders and portfolio managers quickly focus capital on true market leaders.
No need to switch software or change your routine. The GoNoGo Visual Suite integrates directly into leading charting and trading platforms worldwide.